Server Overview
The Dokimos server stores your eval run results and gives you a web UI to view, compare, and track quality over time. Run it when you want a shared place for results instead of files on one laptop.
It also closes the eval loop: hold datasets centrally and pin tests to a version, fail a build when a run regresses, score runs and production traces with an LLM judge, and turn evaluator misses back into new dataset versions.
The loop, end to end: pin a test to a server dataset version, report the run, gate it against its baseline in CI, score runs and production traces with a judge, get alerted on a regression, then review and curate the misses into the next dataset version.
Start the server
Two commands get you running:
curl -O https://raw.githubusercontent.com/dokimos-dev/dokimos/master/docker-compose.yml
docker compose up -d
Open http://localhost:8080. That is the web UI.
A few things to know:
- Your infrastructure. The server runs entirely on your machines.
- Just Docker. The pre-built image from GitHub Container Registry includes everything. You do not build anything locally and you install no extra dependencies.
- Persistent storage. Results live in PostgreSQL.
For a full walkthrough that runs an experiment against the server, see Getting Started.
Why use the server?
- Centralized results. All experiment data lives in one database and can be shared across your team.
- Web UI. Browse experiments, view individual runs, and drill into specific test cases.
- Trend tracking. See how your pass rates change over time and catch regressions before they reach production.
- Team collaboration. Teammates see the same data without passing files around.
- CI/CD integration. Run evaluations in your pipeline and report results to the server.
Architecture
┌─────────────────────────────────────────────────────────────────┐
│                        Your Infrastructure                      │
├─────────────────────────────────────────────────────────────────┤
│                                                                 │
│   ┌──────────────┐     ┌──────────────┐     ┌──────────────┐    │
│   │   Local Dev  │     │   CI/CD      │     │  Production  │    │
│   │  Experiments │     │  Pipeline    │     │   Tests      │    │
│   └──────┬───────┘     └──────┬───────┘     └──────┬───────┘    │
│          │                    │                    │            │
│          └────────────────────┼────────────────────┘            │
│                               │                                 │
│                               ▼                                 │
│                    ┌──────────────────┐                         │
│                    │  DokimosServer   │                         │
│                    │    Reporter      │                         │
│                    └────────┬─────────┘                         │
│                             │ HTTP/JSON                         │
│                             ▼                                   │
│   ┌─────────────────────────────────────────────────────────┐   │
│   │                    Dokimos Server                       │   │
│   │  ┌─────────────┐  ┌─────────────┐  ┌─────────────────┐  │   │
│   │  │   REST API  │  │   Web UI    │  │   Background    │  │   │
│   │  │  /api/v1/*  │  │   React     │  │   Processing    │  │   │
│   │  └──────┬──────┘  └──────┬──────┘  └────────┬────────┘  │   │
│   │         │                │                  │           │   │
│   │         └────────────────┼──────────────────┘           │   │
│   │                          │                              │   │
│   │                          ▼                              │   │
│   │              ┌───────────────────────┐                  │   │
│   │              │     PostgreSQL        │                  │   │
│   │              │  Projects, Runs,      │                  │   │
│   │              │  Items, Eval Results  │                  │   │
│   │              └───────────────────────┘                  │   │
│   └─────────────────────────────────────────────────────────┘   │
│                                                                 │
│   ┌─────────────────────────────────────────────────────────┐   │
│   │                      Browser                            │   │
│   │  ┌─────────────────────────────────────────────────┐    │   │
│   │  │  Dashboard  │  Experiments  │  Runs  │  Items   │    │   │
│   │  └─────────────────────────────────────────────────┘    │   │
│   └─────────────────────────────────────────────────────────┘   │
│                                                                 │
└─────────────────────────────────────────────────────────────────┘
Your code sends results to the server through the DokimosServerReporter. The server stores them in PostgreSQL and serves the web UI.
Data model
The server nests data four levels deep:
- Project: Top-level container (for example, "my-llm-app")
- Experiment: A named evaluation scenario (for example, "customer-support-qa")
- Run: A single execution of an experiment, with timestamp and metadata
- Item: A single test case, with input, output, and eval results
- Run: A single execution of an experiment, with timestamp and metadata
- Experiment: A named evaluation scenario (for example, "customer-support-qa")
Key features
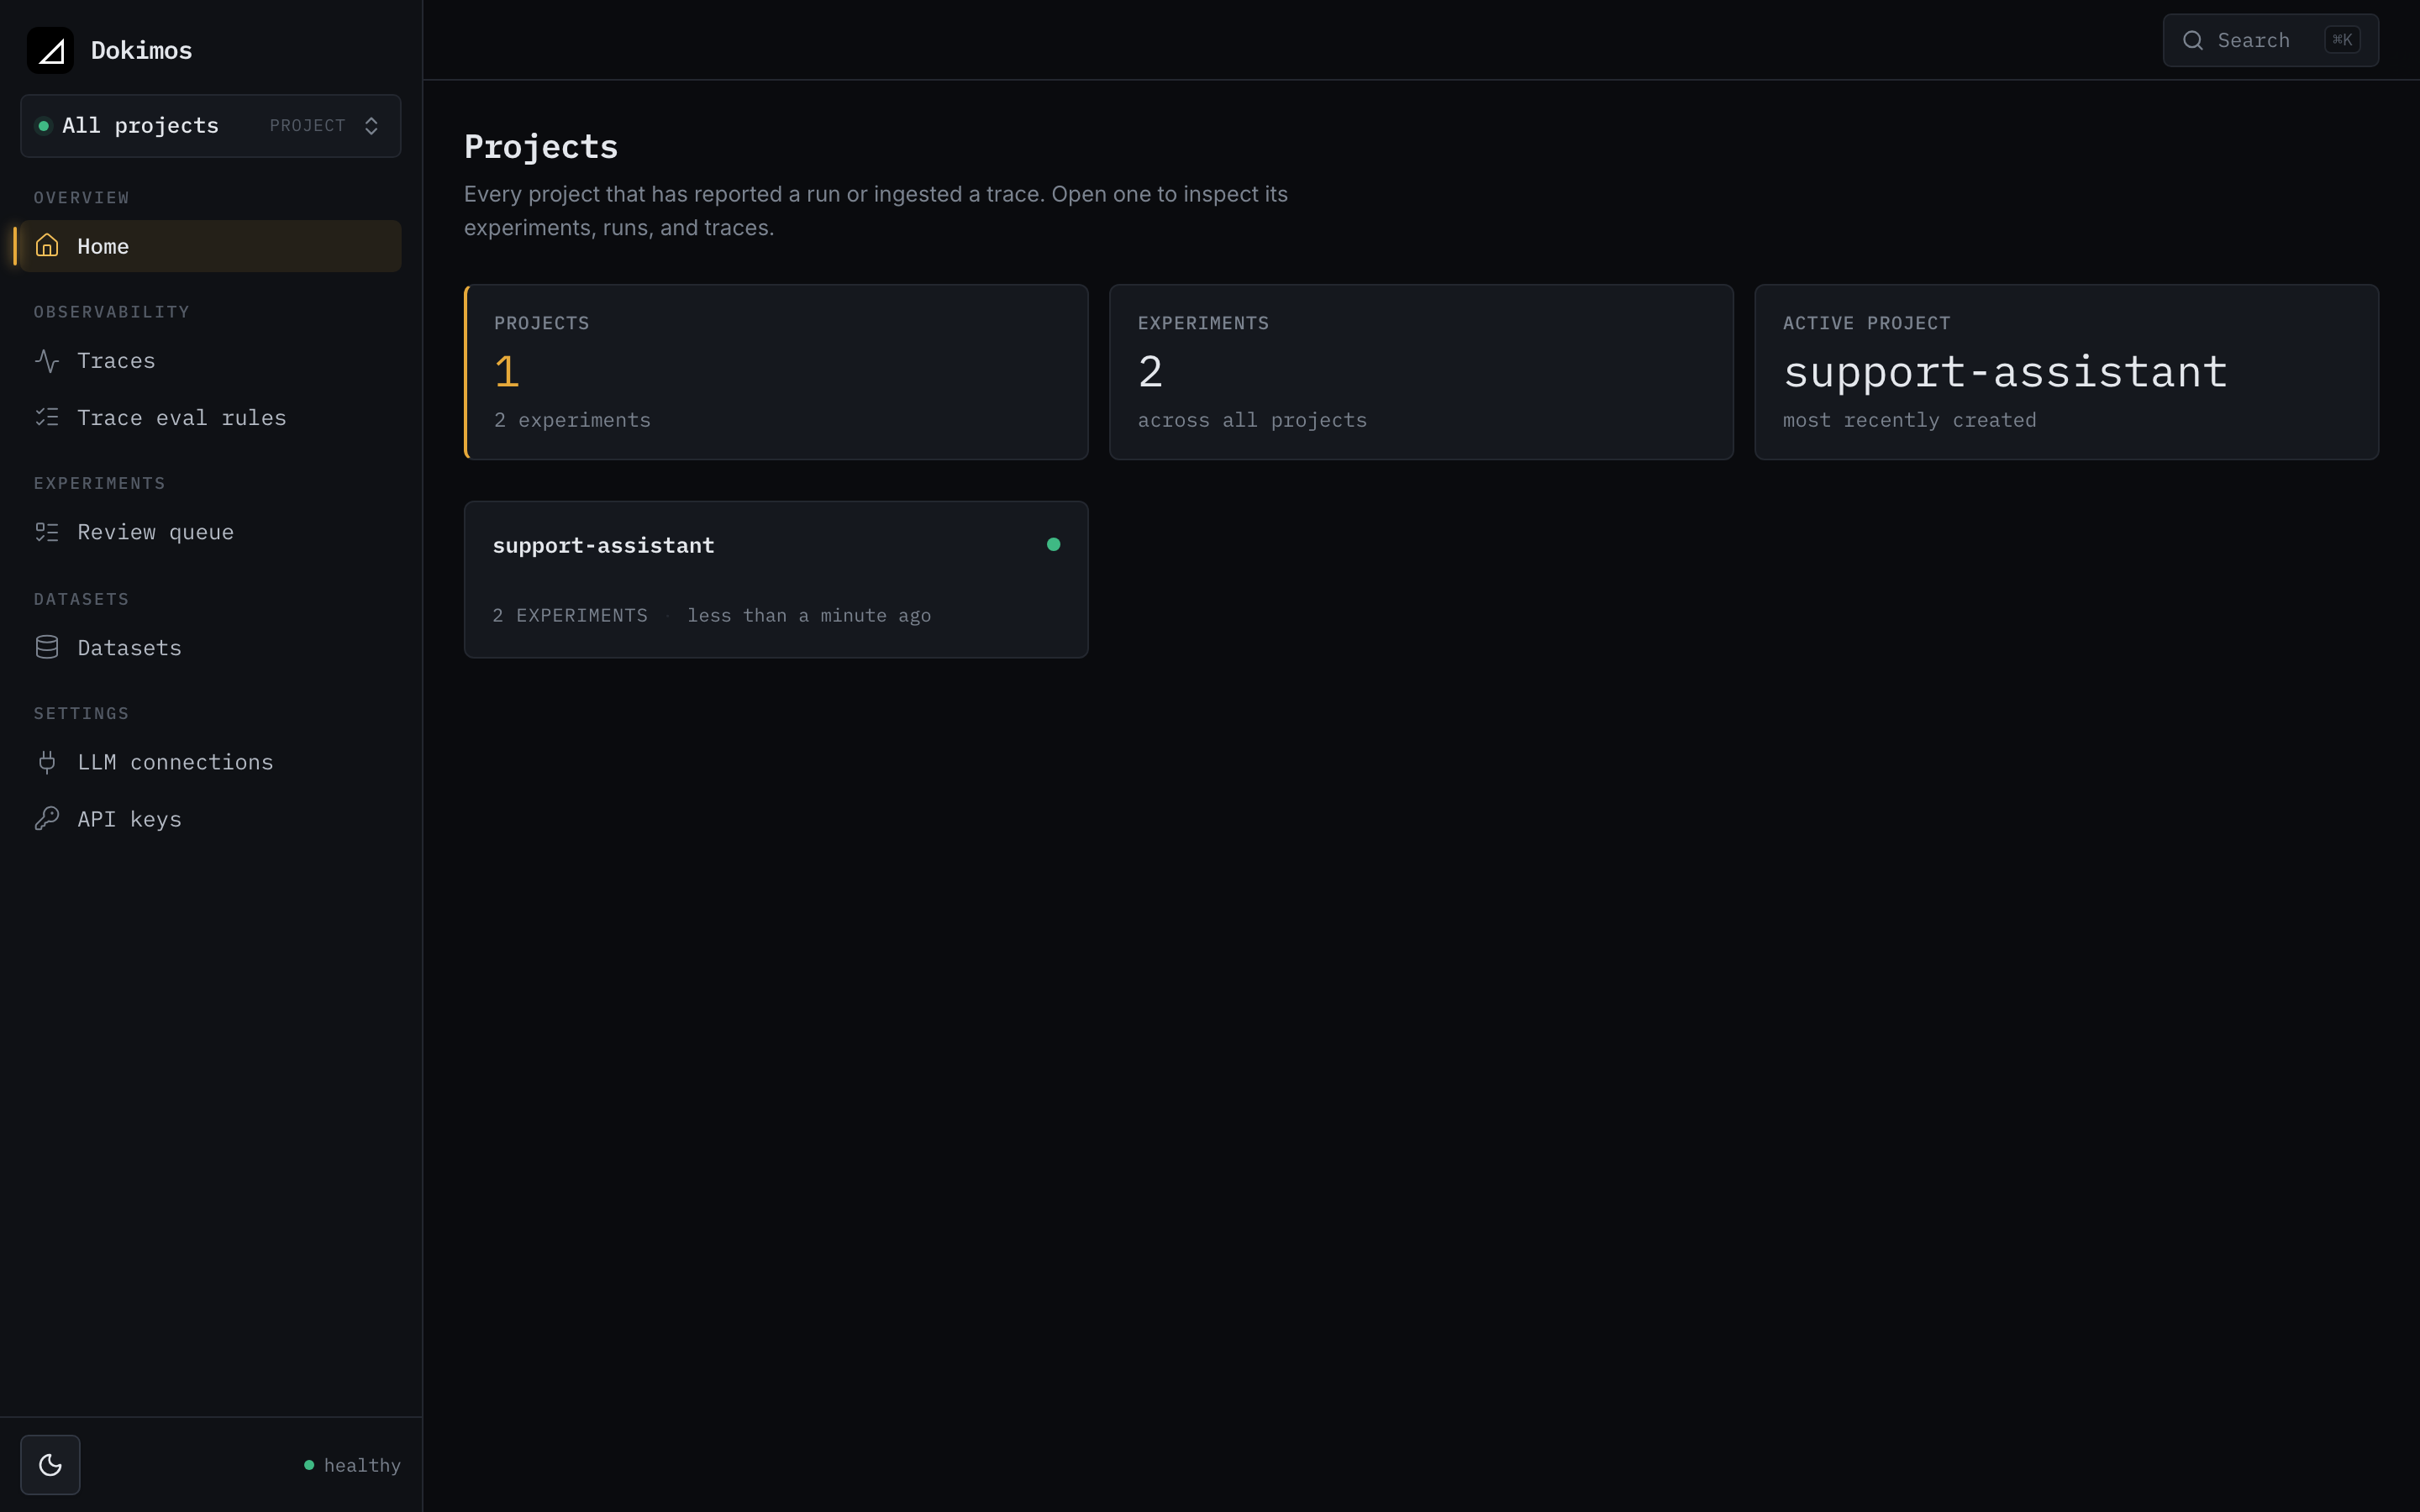
Dashboard
See all your projects in one place with their latest runs.
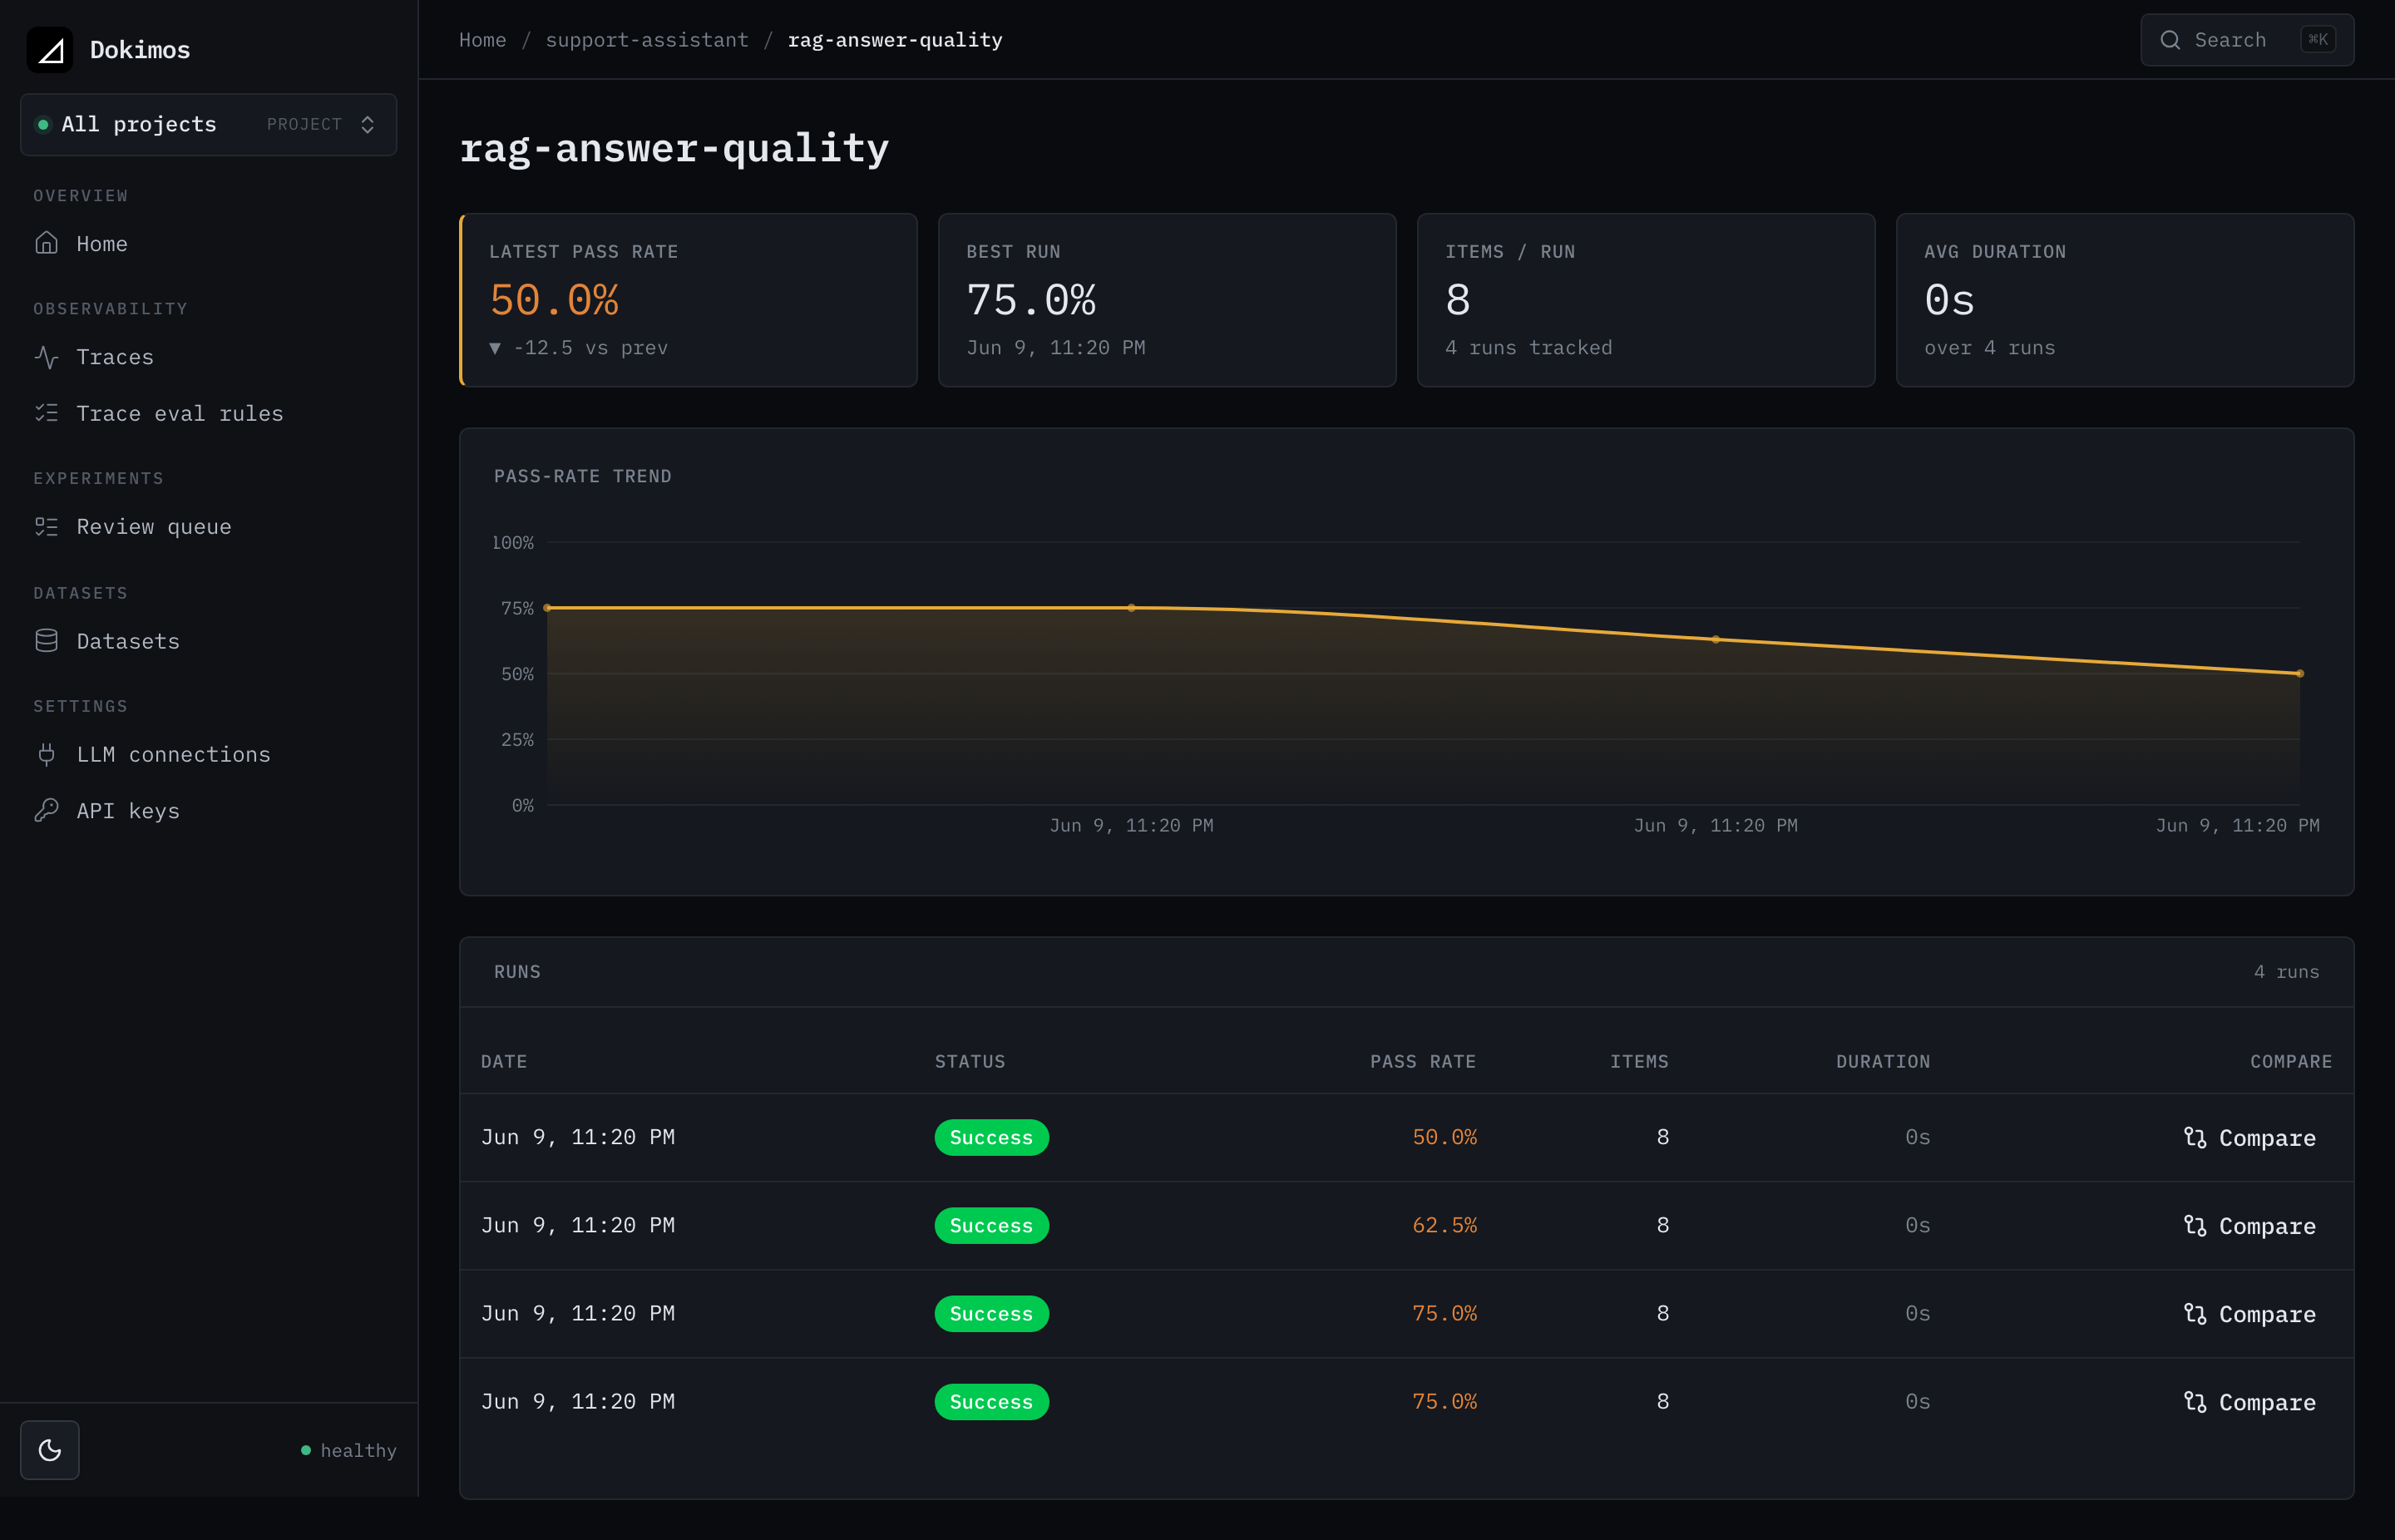
Experiment view
View all runs for an experiment with pass rate trends over time.
Run details
Drill into a run to see individual test cases, scores, and evaluation reasons. Token, cost, and latency roll up into cards when your task reports them.
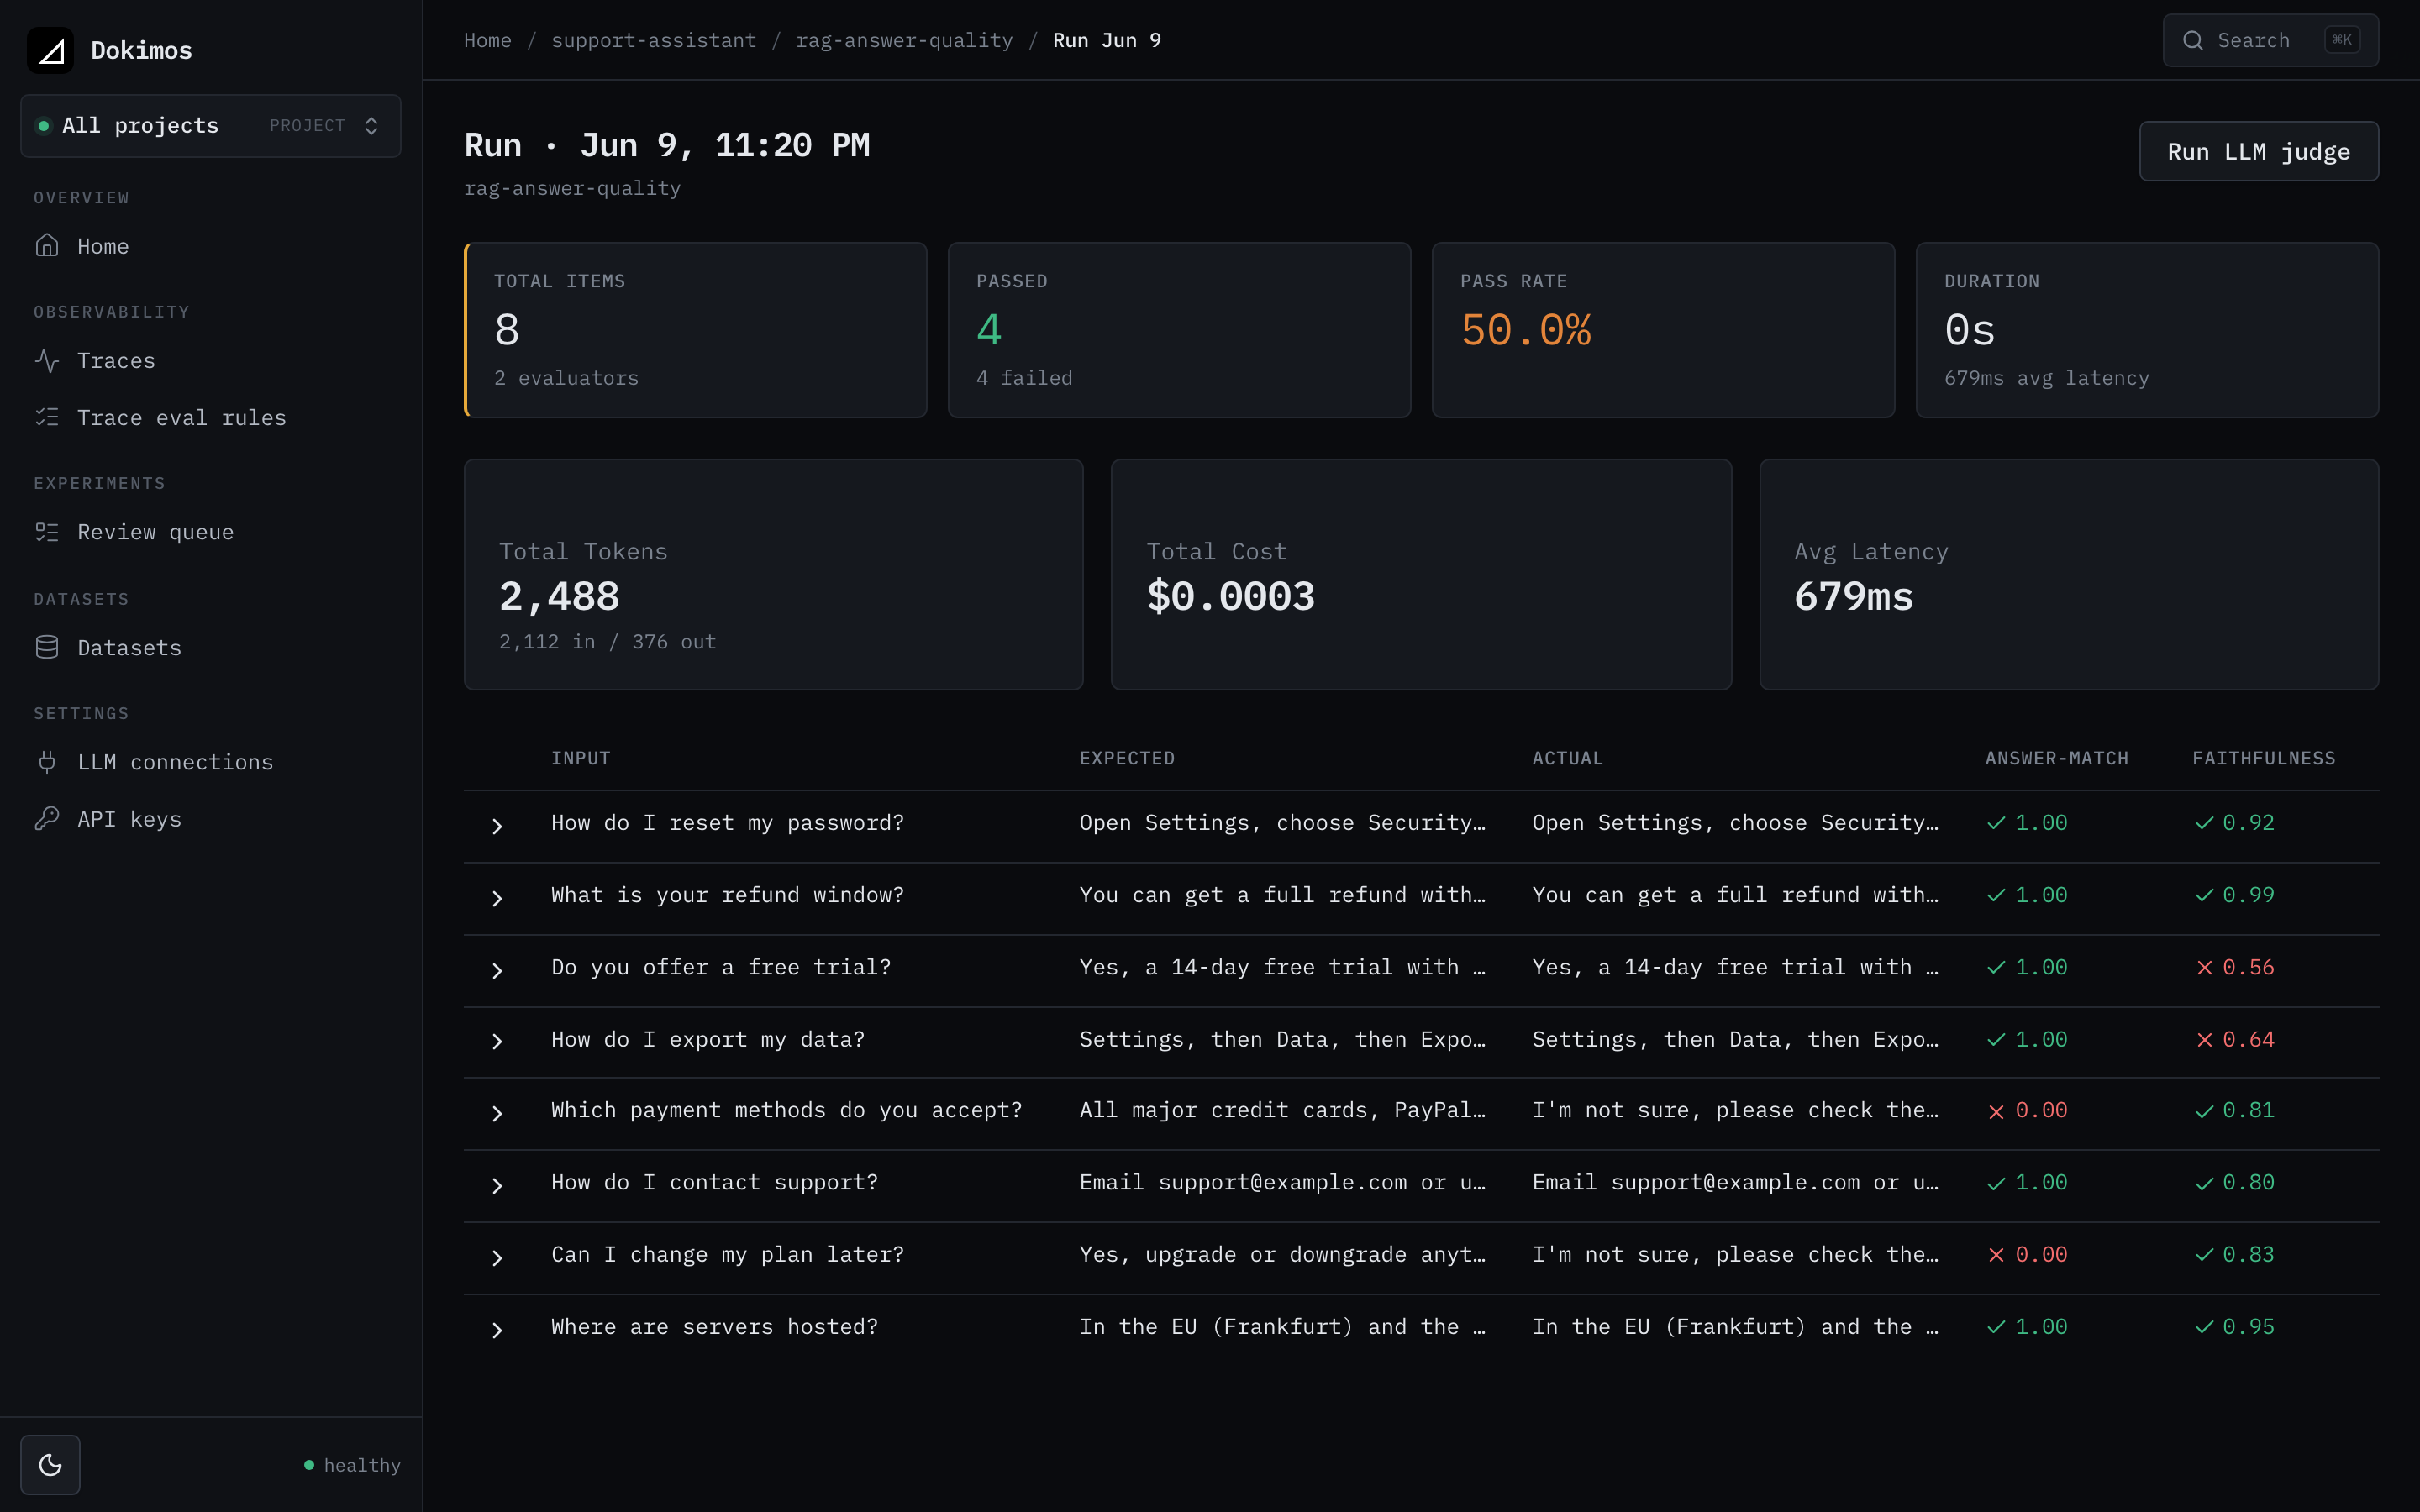
Expandable items
Click any item to see full input/output text and detailed evaluation results.
Server datasets
Hold your datasets on the server, versioned and shared, and reference a specific version from code by URI. See Server datasets.
Review and curation
Review the items evaluators got wrong, annotate them, and promote them into a new dataset version. See Review and curation.
Run comparison
Compare two runs item by item to see exactly what a change moved. See Comparing runs.
LLM judge
Score runs and traces on the server with an LLM as judge, using a stored connection that speaks the Open Responses or Chat Completions API. See LLM judge.
Production traces
Ingest OTLP traces from your running app and evaluate them online as they arrive. See Production traces.
Regression alerting
Get a webhook when a run regresses against its baseline. See Regression alerting.
Next steps
- Getting Started: Run your first experiment with server reporting
- Configuration: Environment variables and settings
- Deployment: Share with your team or run in production
- Authentication: Secure write operations and scope API keys by role
- Client: Reporter client configuration
- Server datasets: Hold datasets on the server and reference them by URI
- Review and curation: Turn evaluator misses into new dataset versions
- Comparing runs: Diff two runs item by item
- LLM judge: Score runs and traces with an LLM as judge
- Production traces: Ingest and evaluate production traffic
- Regression alerting: Webhook on a quality drop